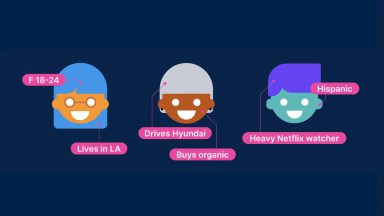
Identity is a big topic in data-driven marketing. Advertisers want to target consumers at the person level, publishers want to monetize their audiences, and identity is crucial to ensure that the “John Smith” the brand is trying to reach and the “John Smith” currently shopping on Amazon, scrolling through TikTok, or searching for a weekend event on Ticketmaster are indeed the same person.
Up until now, mobile ad IDs (MAIDs) and third-party cookies were used to connect the dots, at least across open digital platforms. But their days are coming to an end, and the transition continues to be hectic. What options do marketers have now?
Most marketers are betting on first-party data because it allows them to stand out from their competitors, maintain control over their data assets, and steer clear of privacy complications. But everyone uses different identifiers. Netflix knows you by your email address, Macy’s by your phone number, Delta by your SkyMiles number, Instagram by your handle, Xbox by your gamertag. A website you visit without logging in might still assign you a third-party cookie today or collect your IP address.
For consistent, comprehensive and comparable audience measurement across platforms, marketers need a robust ID system with an identity graph designed specifically for measurement.
What’s an identity graph?
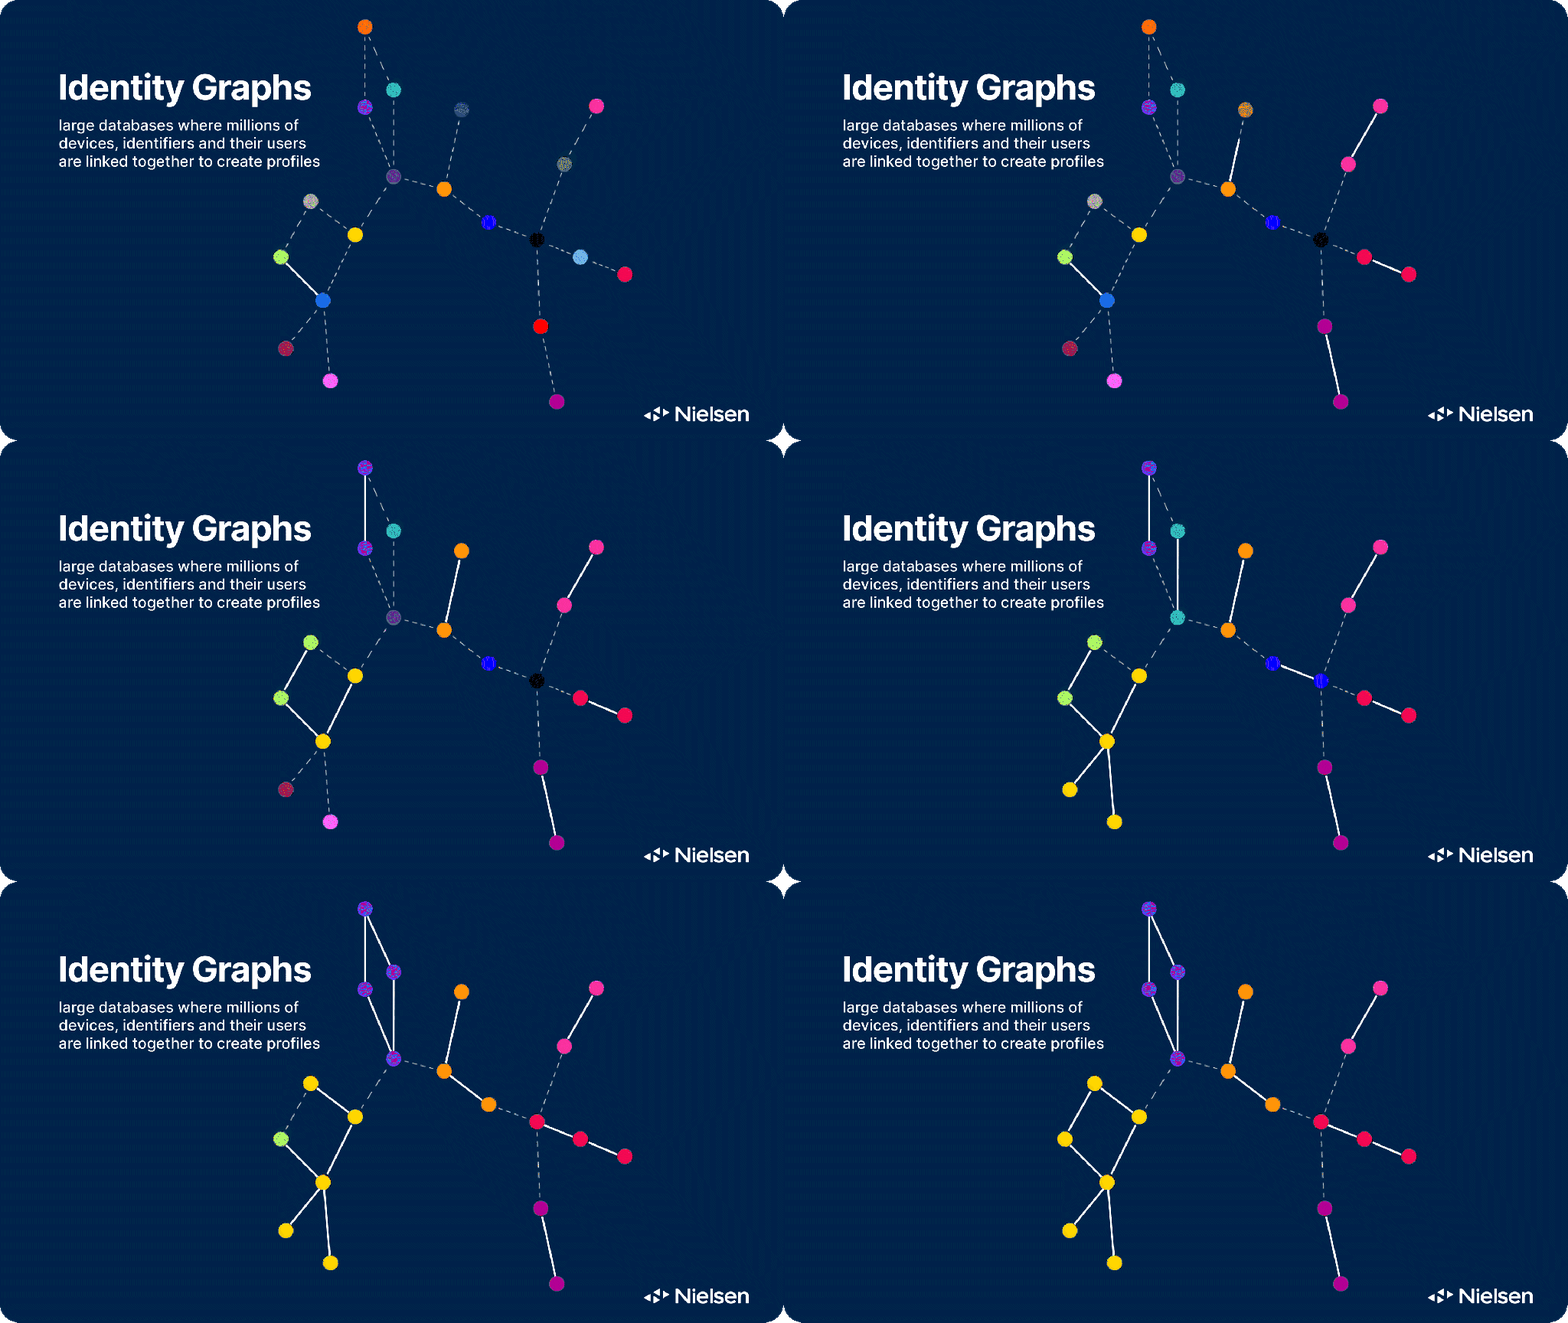
Consumers use many devices, apps and identifiers to interact with the world, and those interactions leave a steady trail, like snapshots in a photomosaic. Every snapshot tells only one fragment of the story, but put together, they produce a 360° portrait of who we are, our likes and dislikes, our interests and preferences, and—most crucially for marketers—what we might do next.
To put the pieces together, large advertisers, publishers and data providers have developed identity graphs: large databases where millions of devices, identifiers and their users are linked together to create unified customer and household profiles. They use those graphs for targeting and personalization, matching customers and prospects on a brand’s mailing list to a platform’s audience members. For example, Nielsen’s activation side of the business has a graph that focuses on targeting.
Campaign activation isn’t the only reason to use an identity graph. Let’s examine why a reliable, independent and well-calibrated identity graph is essential for modern measurement.
What makes a measurement-grade identity graph different?
Not all identity graphs are focused on accurately representing the population at large. The data sources they use might be biased toward a certain geography, the users of a certain platform or just one type of device. Deduplicating records may not be a top priority either, as long as some matching can take place and ads end up in front of people.
But match rates aren’t everything. If measurement is the ultimate goal, statistical representation and deduplication are necessary to properly measure reach, frequency and other important campaign KPIs like return on ad spend (ROAS) or lead conversions. At Nielsen, when we load new data into our identity graph, we take great care to validate matches between devices, people and households against census data and our own people-based panels. As we learned earlier in our Need to Know series, carefully curated people-based panels are critical to calibrate big data.
How extensive is our data cleanup process? Every year, our systems ingest billions of identifiers and links from a wide variety of external data sources, but only 20% make it into the resolved identity graph. We use our people panels to calibrate these Big Data sets and ensure the accuracy of our audience assignments and graph clustering. As a result, the Nielsen Identity graph is optimized for the representativeness and accuracy needed for measurement.
How are marketers using the Nielsen identity graph?
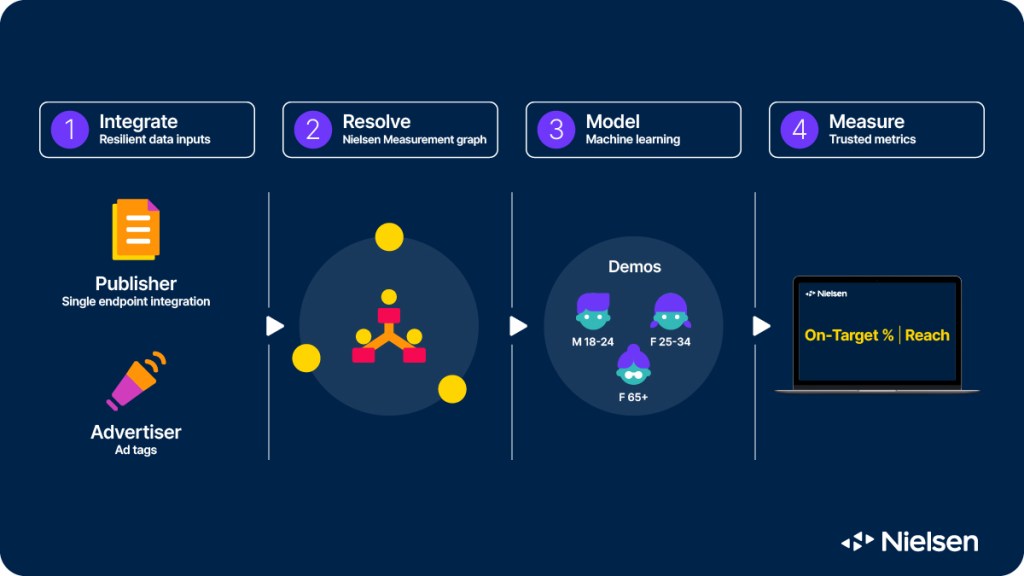
Identity graphs are not built to stand alone. The Nielsen identity graph sits at the center of a comprehensive ID system that includes four distinct steps:
Step one
Data Ingestion
Everything starts with ingesting data relevant to a client’s campaign. This could be first-party advertiser and publisher data; third-party data to enrich customer profiles with new attributes; data to add volumetric insights from digital platforms; and big data from program distributors and smart TV manufacturers for viewing data.
Step two
Identity Resolution
The second step consists of matching new data inputs to the Nielsen identity graph to draw the correct links between devices, identifiers and people. Once the data associated with each profile has been validated, we’re able to assign a unique ID (called the Nielsen ID) to the records.
Step three
Audience and user journey modeling
The next step in the process is to compare demographics from external data sources against verified demographics from our panel to address data gaps and calibrate for inconsistencies. Advanced machine learning techniques are then used to deduplicate audiences and build user journeys that faithfully account for all relevant touchpoints and outcomes associated with the campaign.
Step four
Campaign Measurement
Finally, it’s time to produce audience metrics (like reach, frequency, on-target % or cross-media metrics) and outcomes metrics (like sales, ROAS or cost per lead) to report on the campaign’s true, unbiased, unduplicated and properly-attributed results.
As we mentioned earlier in the article, Nielsen’s activation side of the business, Nielsen Marketing Cloud, has a person-level activation graph that uses many of the same sources as Nielsen’s measurement graph and shares the same resolution logic that delivers a deduplicated view of the audience. But instead of measurement, it’s engineered to drive campaign reach and personalization at scale.
What are the privacy implications of a digital ID system?
Ingesting ad exposure and outcomes data from external sources can be a thorny proposition in today’s data privacy climate. Even when user consent has been secured, marketers are justifiably nervous about testing the limits of that consent by sharing customer data with outside partners. This is especially true in highly regulated industries like healthcare or financial services. Hash algorithms can help obscure sensitive identifiers like email addresses, but hashed IDs are considered personal identifiable information (PII) in some jurisdictions (like Europe), and they can’t always prevent bad actors from identifying the person behind the hashed ID anyway.
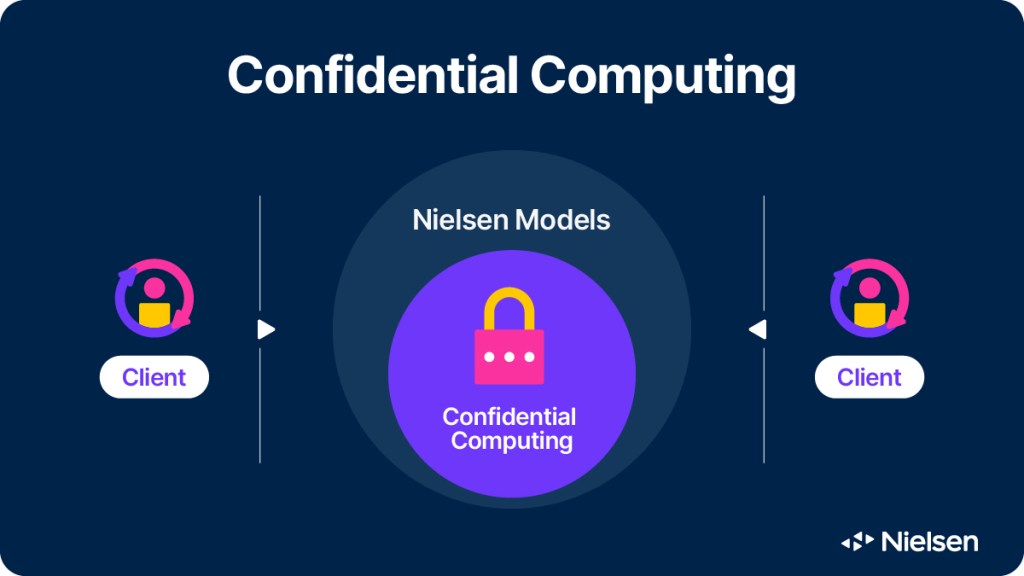
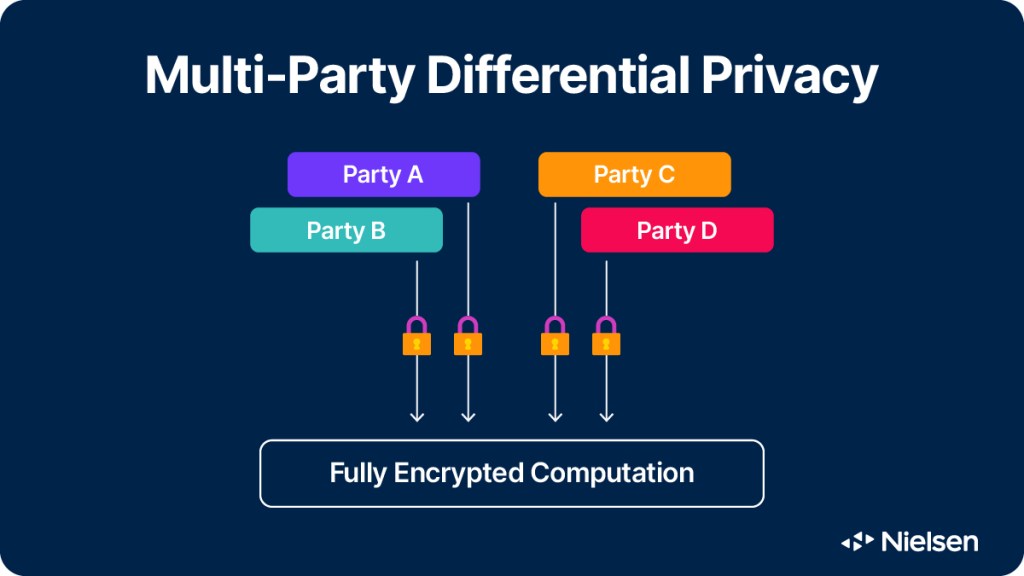
What’s the solution? At Nielsen, we’ve implemented a suite of data privacy and security processes to facilitate data collaboration (such as finding the overlap between an advertiser and a publisher dataset) without actually sharing sensitive information between data partners. For example, clean room integrations ensure data from Nielsen, our clients and our partners stay within their respective environments while still enabling measurement. Techniques like confidential computing and differential privacy allow for parties to work together without seeing each other’s data.
Privacy is a top priority for marketers and consumers. Any digital ID system you work with should take it seriously.
Digital measurement beyond third-party cookies
Third-party cookies might be on their last leg, but marketers still need to make sense of their cross-platform campaigns. And they want to capitalize on new planning and targeting opportunities—like those unlocked by advanced audiences—to stay ahead of their competitors.
Perhaps more than ever, marketers need measurement partners that can help them connect the dots, and produce accurate and consistent audience and outcome metrics relevant to their business.
Nielsen’s Need to Know reviews the fundamentals of audience measurement and demystifies the media industry’s hottest topics. Read every article here.
